2006年Activity Level(日本国内統合グラフ)
このページは,毎月,全国の観測者から寄せられてくるデータが集約されたRMOJのデータを元にして,2006年の全国統合グラフ(Activity Level)を作成しています。月例報告では,あくまで国内の観測地点のみ統合グラフにしています。RMOJに関する詳しい事項はこちらのページをご覧下さい.(※各月のグラフをクリックすると別ウィンドウが立ち上がります)
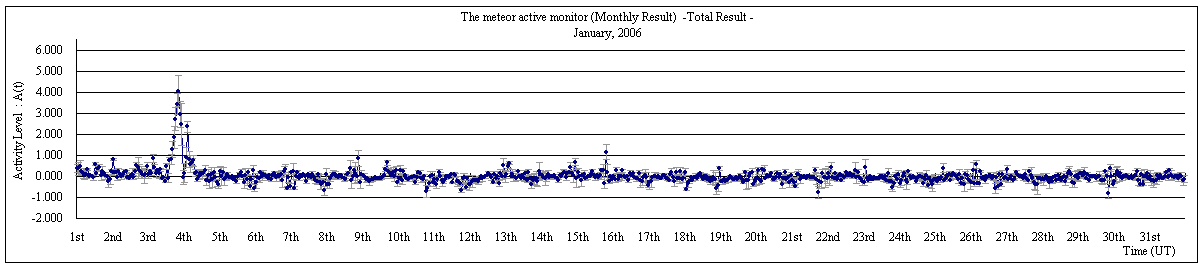
1月
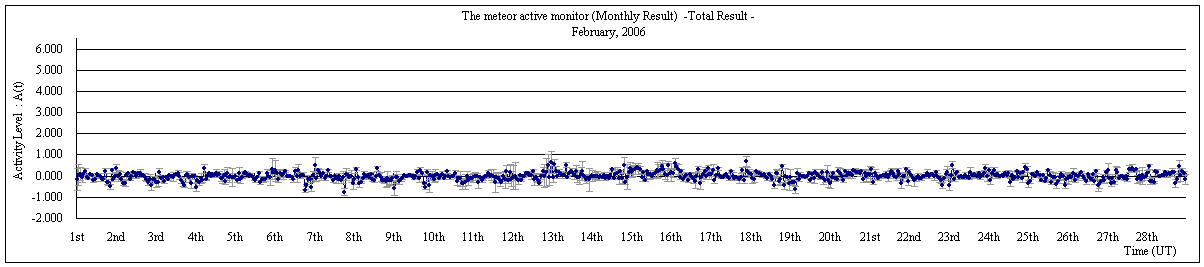
2月
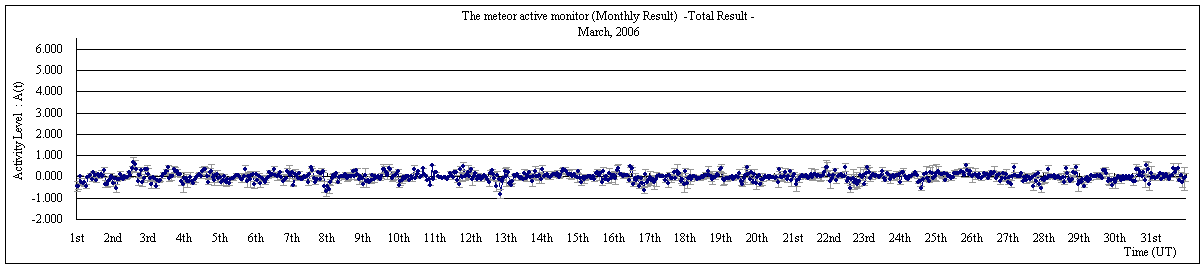
3月
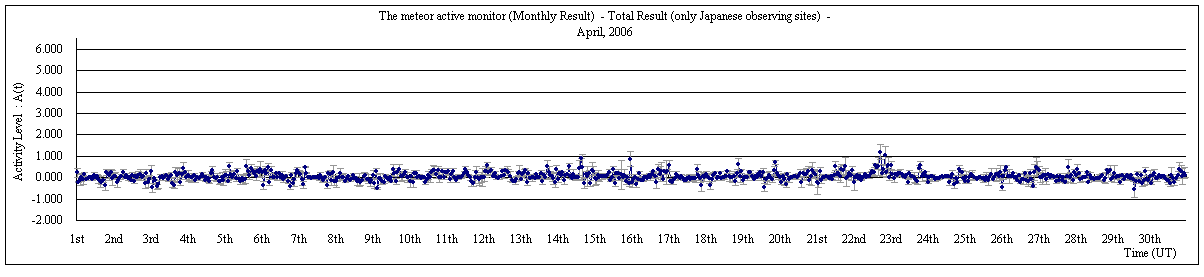
4月
5月

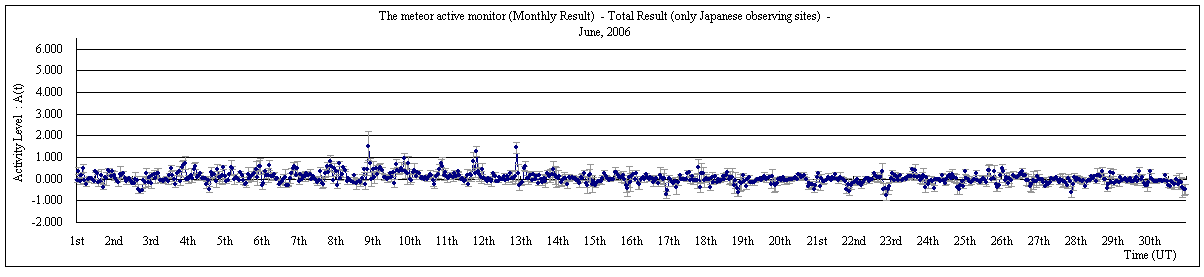
6月
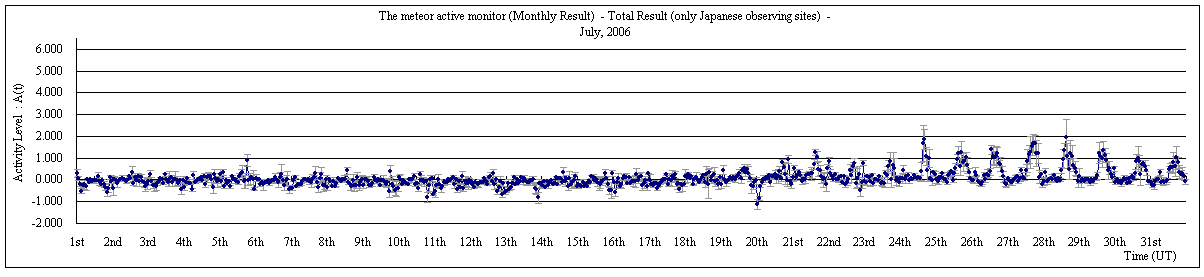
7月
8月

9月

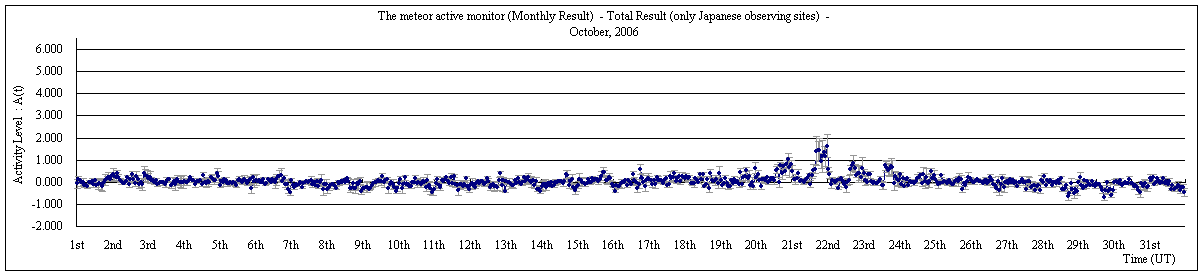
10月
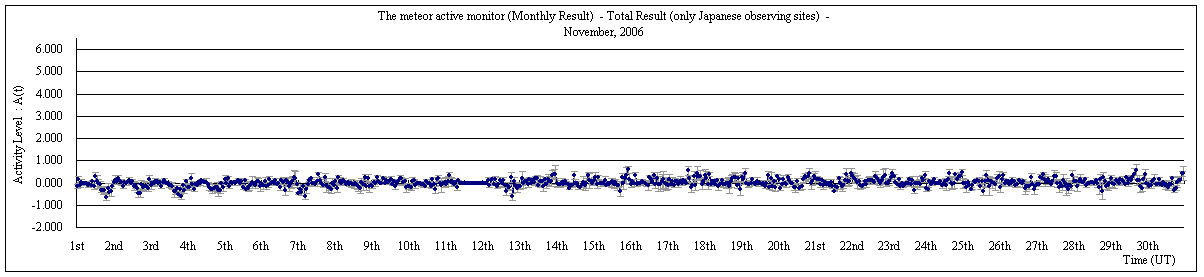
11月
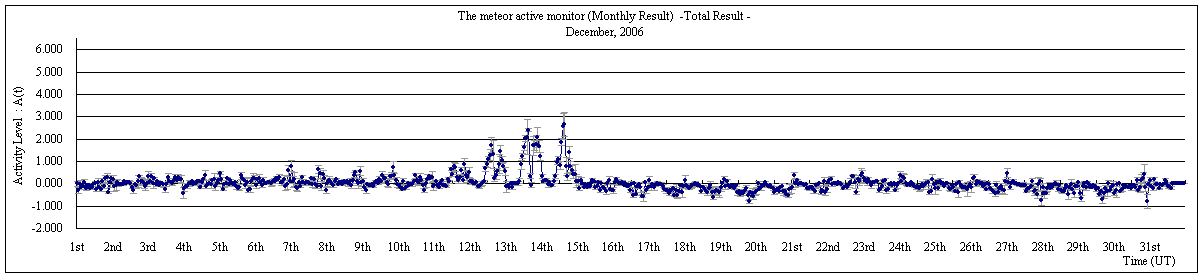
12月
![]()
このページは,毎月,全国の観測者から寄せられてくるデータが集約されたRMOJのデータを元にして,2006年の全国統合グラフ(Activity Level)を作成しています。月例報告では,あくまで国内の観測地点のみ統合グラフにしています。RMOJに関する詳しい事項はこちらのページをご覧下さい.(※各月のグラフをクリックすると別ウィンドウが立ち上がります)
1月
2月
3月
4月
5月
6月
7月
8月
9月
10月
11月
12月